From scattered risk data to one strategic view
Sole designer on a supply chain risk platform used daily by risk analysts and procurement teams at Dell, Texas Instruments, AMD and 3M.
Role
Senior Product Designer, sole designer across five product modules
Year
2024–Present
Industry
Supply Chain / B2B SaaS
4–5 → 2
review rounds per feature
1
new enterprise deal, won against a competitor's tool
30%+
productivity gain for adopting developers (front-end team lead estimate)
Where things stood
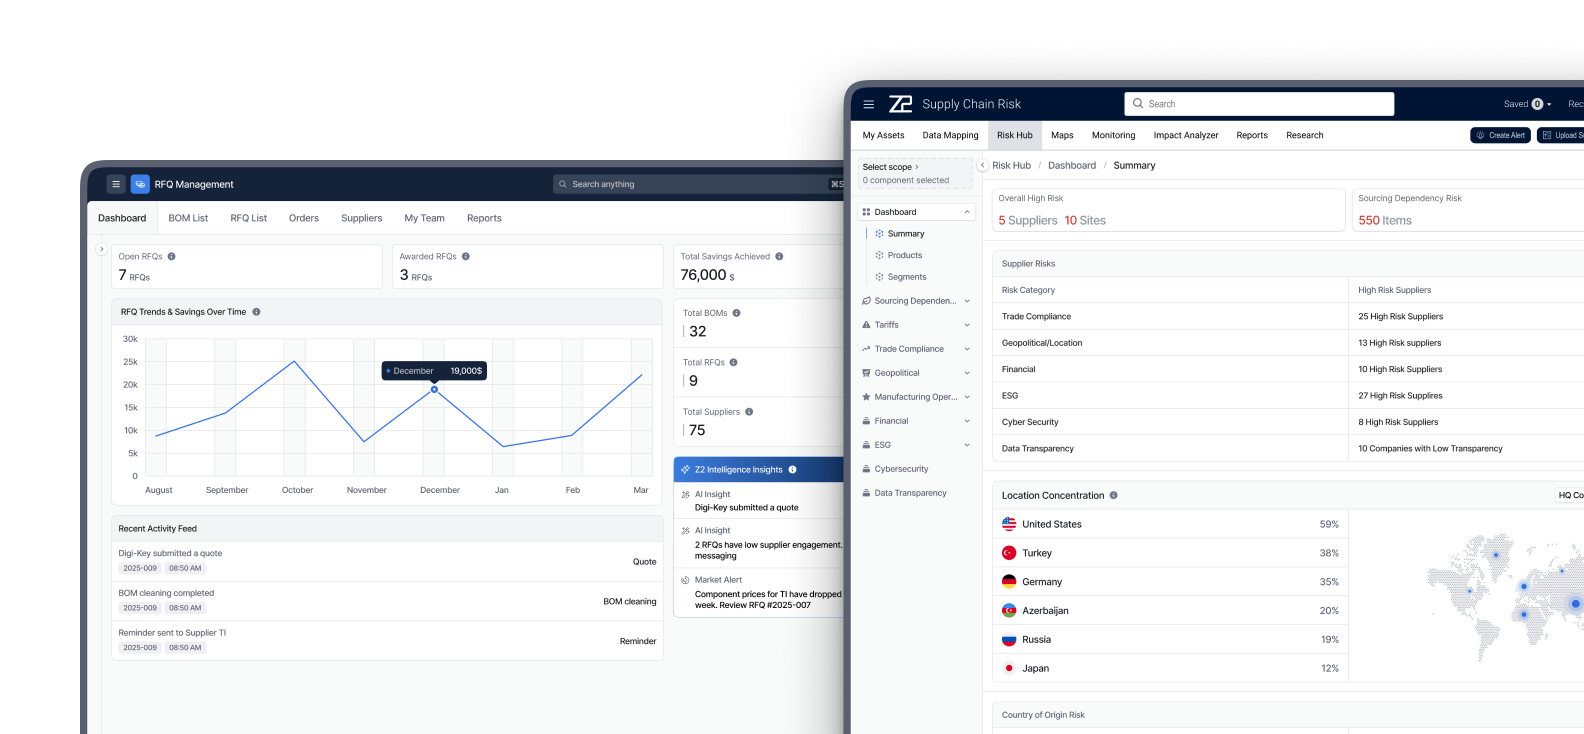
I joined as the only designer on the platform, working across five product modules. The platform serves several roles, from risk analysts to procurement managers, who read the same data to make different decisions.
Three things needed work at the same time. Risk decisions meant jumping between dashboards and tables, so building a full picture of a part meant stitching screens together by hand. Most feature reviews ran 4 to 5 rounds, and most of that feedback came back to data. And developers were hardcoding components, so the interface drifted with every release.
What I did
- 1
Designed for density instead of simplicity, because these users wanted more on one screen rather than less.
- 2
Started every task from a real data sample and one question to the PM, which cut review rounds roughly in half.
- 3
Turned PMs and data leads from sources of information into co-designers.
- 4
Validated flows as interactive prototypes before they reached engineering.
- 5
Designed the RFQ module from scratch, which helped win a new enterprise client.
- 6
Rebuilt the visual language on enterprise conventions and took the design system into code.
Density over simplicity
The instinct in design is to simplify. Interviews with analysts and procurement managers said the opposite, and so did the feedback from the teams running demos with Dell, Texas Instruments and others. These users wanted more on one screen. They were already assembling the full picture in their heads.
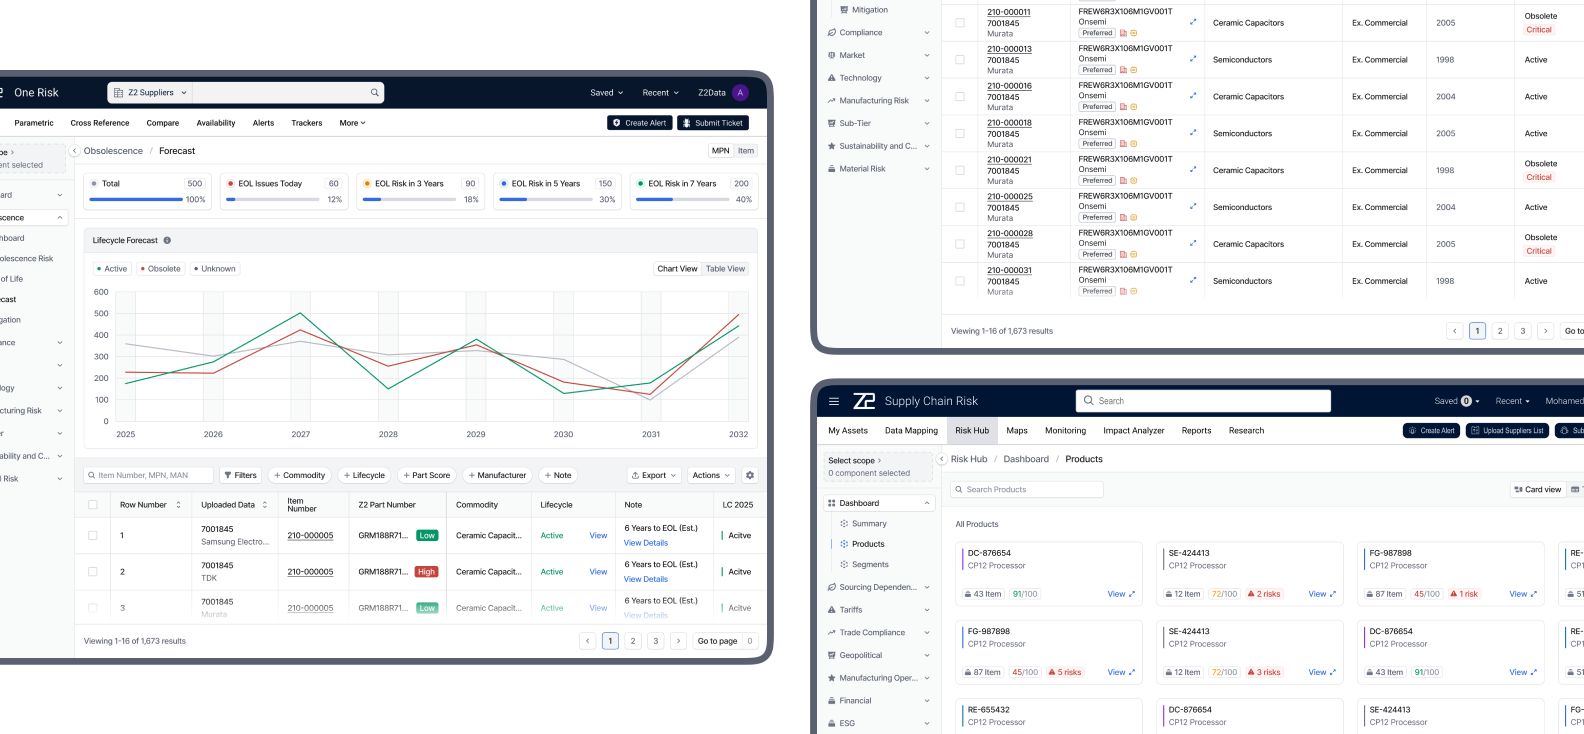
So I designed a Strategic View of MPN (manufacturer part number) risk: KPI cards, charts, data cards and tables that bring together what used to live across several screens. Built for analysis, not for browsing.
Starting from the data, not the screen
When I joined, most feature reviews took 4 to 5 rounds, and most of the feedback came back to data. The prototypes looked right, but they did not reflect how the company's data actually behaves.
So I changed where I start. Before any screen, I pull a real data sample and ask the PM and the data lead one question: what is this for? Reviews dropped to about two rounds per feature. What comes back now is mostly visual preference, and when a data issue does surface, it usually originates in the data itself rather than in the design.
PMs and data leads as co-designers
PMs and data team leads had good ideas about the product, but they were treated as sources of information, and design language felt out of reach to them. I ran working sessions where I translated their raw data and abstract ideas into designs they could react to.
They now bring me in at the start of new work instead of at review, and some of them use a ChatGPT skill I built and published internally.
Validating before development
Direct access to end users at client companies is limited, so I validate through the people closest to them. For each flow I build an interactive HTML prototype with AI tools, close enough to the real product to click through, and review it in stages: first with the PM and the data lead responsible for the task, then with the CPO and CEO, who demo the product to clients. Each round shows where the flow breaks before it reaches engineering.
RFQ, from zero to a won deal
I designed the RFQ (Request for Quote) module from scratch, working with the PM lead from research through design. The PM lead drove the competitive research; I drove the design.
A prospective client was already using a similar tool from a competitor. We covered the workflow they needed end to end, including its integrations, and won the deal. The module was later absorbed into the core product.
Calibrating taste to context
My early instincts came from consumer products: soft 8 to 16px corners, playful icons and interactions. The feedback was consistent. These are serious users making expensive decisions. I studied mature enterprise systems like IBM Carbon and collected the patterns that fit our context.
A colleague built the foundation of our design system. I took ownership of it, extended and revised it, then translated it from Figma into code using AI coding tools (Antigravity), reviewing it with our front-end team lead.
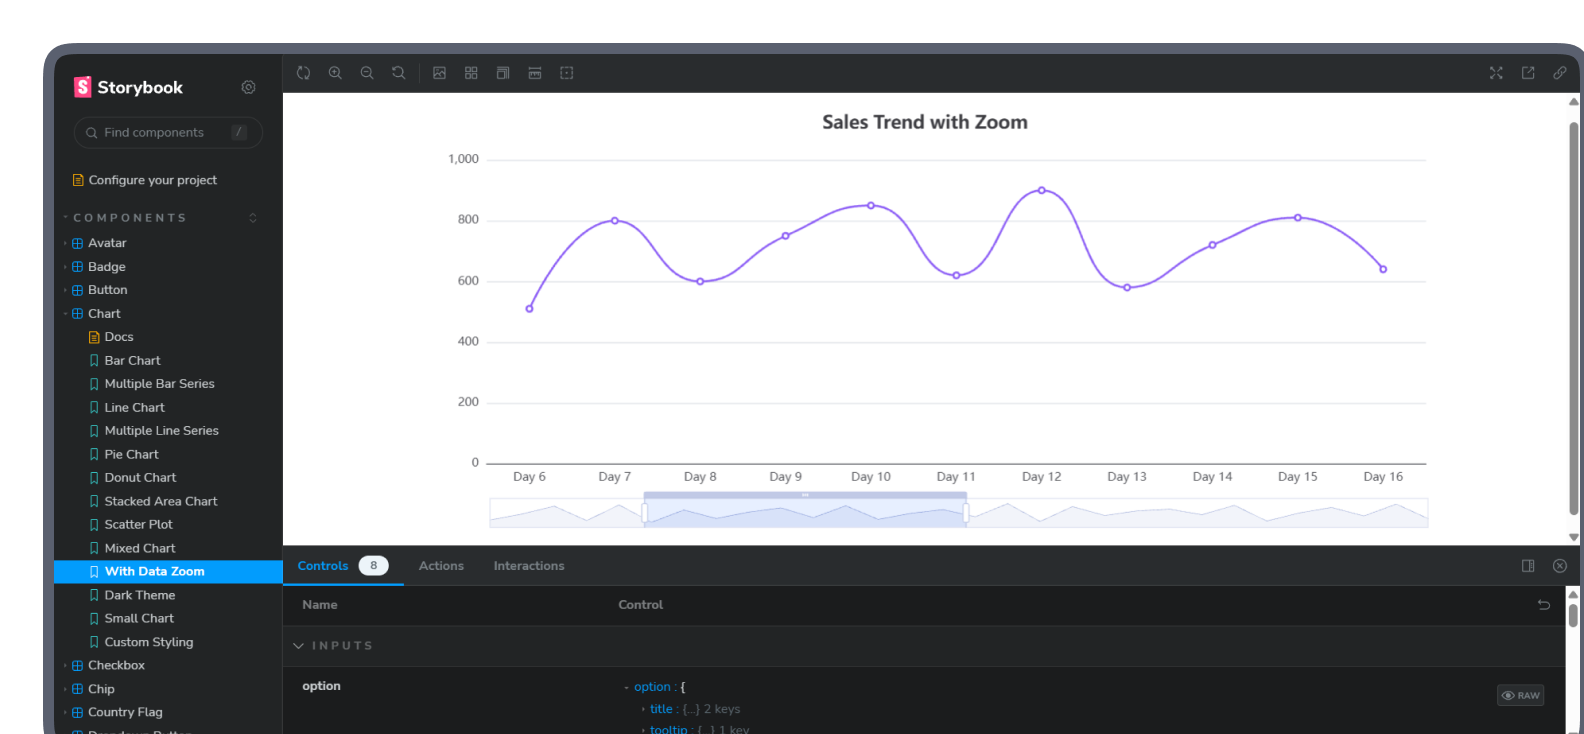
Developers were still hardcoding components, so I built an AI-assisted Storybook for Angular. The developers who adopted it stopped hardcoding, and the front-end team lead estimated a 30%+ productivity gain. Adoption is still limited to a set of components, since the complexity of our system and our delivery timelines have not allowed a full rollout yet. I have since taught the approach to designers at other companies, who implemented it with their own teams.
What changed
Review rounds per feature went from 4 to 5 down to about 2, and the remaining feedback is mostly visual preference rather than data.
RFQ was designed from scratch, helped win a new enterprise client, and was later absorbed into the core product.
PMs and data leads bring design in at the start of new work.
Flows are validated as interactive prototypes with PMs, data leads, the CPO and CEO before development.
30%+ productivity gain for the developers who adopted the Storybook (front-end team lead estimate).
The platform is used daily by procurement teams at Dell, Texas Instruments, AMD, 3M and Google Pixel.
What I learned
My own taste was the first constraint I had to design around. The data was the second. The most useful part of my work now happens before the first screen, in a real data sample and in one question to the PM.